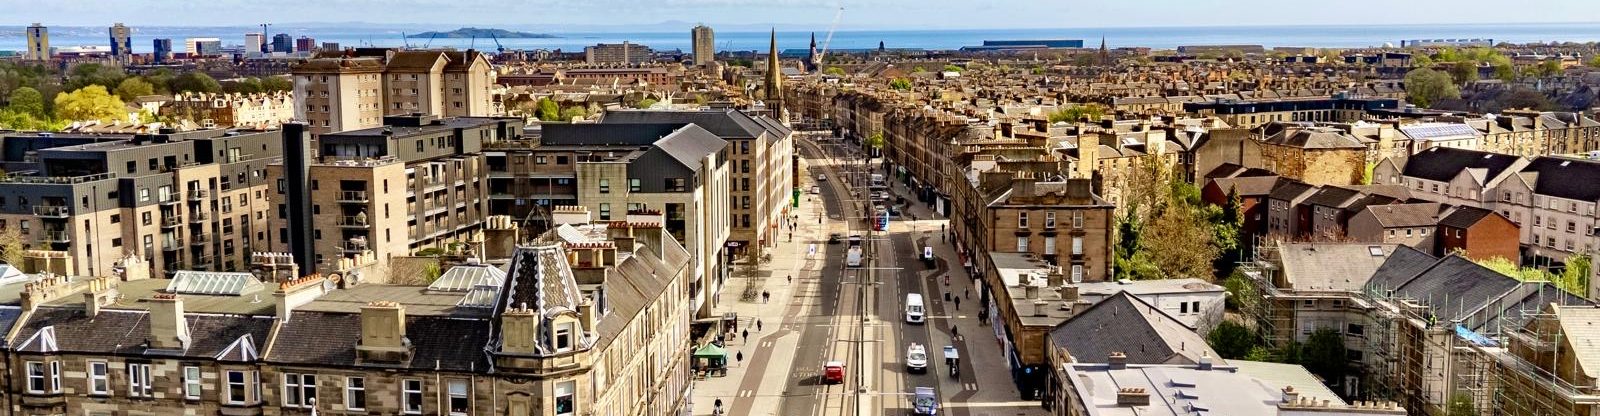
We’ve started developing a set of data to help us better understand Leith Central and the wider area around us.
This is very much a work in progress, but the aim is simple: to build a clearer picture of who lives here, how the area is changing, and how that should inform the work of the Community Council.
The charts bring together publicly available data on things like:
- housing tenure (owner-occupied, private rented, social rented)
- income levels and indicators such as Universal Credit
- the balance between flats and houses
- comparisons with neighbouring community council areas
Taken together, they begin to show how Leith Central sits within a wider and very diverse part of the city.
Why this matters
As a Community Council, we are regularly asked to comment on planning applications, licensing matters and wider policy issues.
Having a better understanding of the make-up of our community helps us to:
- reflect a broader range of local experiences
- identify where there may be gaps in representation
- think more clearly about priorities
This is particularly relevant in areas like housing, where questions around tenure, affordability and use (including short-term lets and student accommodation) are ongoing.
A work in progress
This is an early draft and will continue to evolve. We expect to refine the data, improve how it is presented, and explore additional sources over time.
We’re sharing it now because it’s already proving useful in shaping our discussions — and we’re keen to be open about how we approach this.
Have your say
We’d be interested to hear your thoughts:
- Does this reflect your experience of living in the area?
- Is there anything here that surprises you?
- Are there other aspects of the community you think we should be looking at?
You can get in touch via our website or come along to one of our meetings.
